Fuel
Refuelling and Draining
1. Select one or several objects.
2. Select a period of time for report generation.
3. Press button “Add report” and select “Refuelling and draining”.
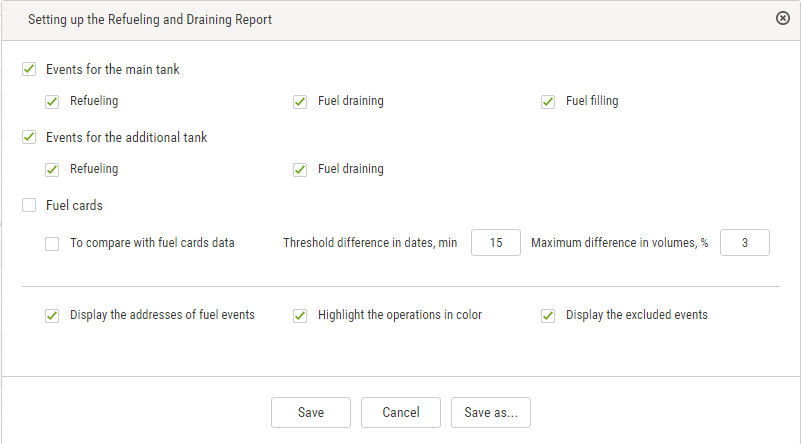
Select the information to be displayed in the report pressing the right mouse button and choosing “Report settings”
For fuel tankers of primary tank refuellings and drains are displayed, for an additional tank — refuellings and drains.
Exception of the events from the report is allowed for primary tank of vehicle. In section fuel cards specify following:
“Compare with fuel cards data” — turn on to compare fuel volume filled in VH in accordance with Omnicomm Online data with fuel card data.
“Threshold difference in dates, min” — specify allowed difference in date and time of refuelling between Omnicomm Online and fuel card data. Default value is 15 min.
“Maximum difference in volumes, %” — specify allowed difference in volume of fuel filled in between Omnicomm Online and fuel card data. Default value is 3%. There is an opportunity to apply color indication and data fit. To turn on color indication select “Select operations with color”.
With turned-off “Compare with data of fuel cards” parameter:
White background of line is for refuelling
Pink background is for fuel drain
Gray background of line is an excepted event of drain or refuelling
With turned-on “Compare with data of fuel cards” parameter:
Green background of line means a volume of refuelling according to Omnicomm Online data corresponds to refuelling volume according to a fuel card taking in account values of parameters “Threshold difference in dates, min” and “Maximum volume difference, %” Pink background is for fuel drain
Blue background of line means refuelling has been performed without a fuel card or refuelling according to Omnicomm Online does not correspond to fuel card data (considering value of “Threshold difference in dates, min” and “Maximum volume difference, %” parameters)
Gray background of line is an excepted event of drain or refuelling With turned-on display excepted events are displayed on grey line background with ticked “Exception”. Press button “Apply”.
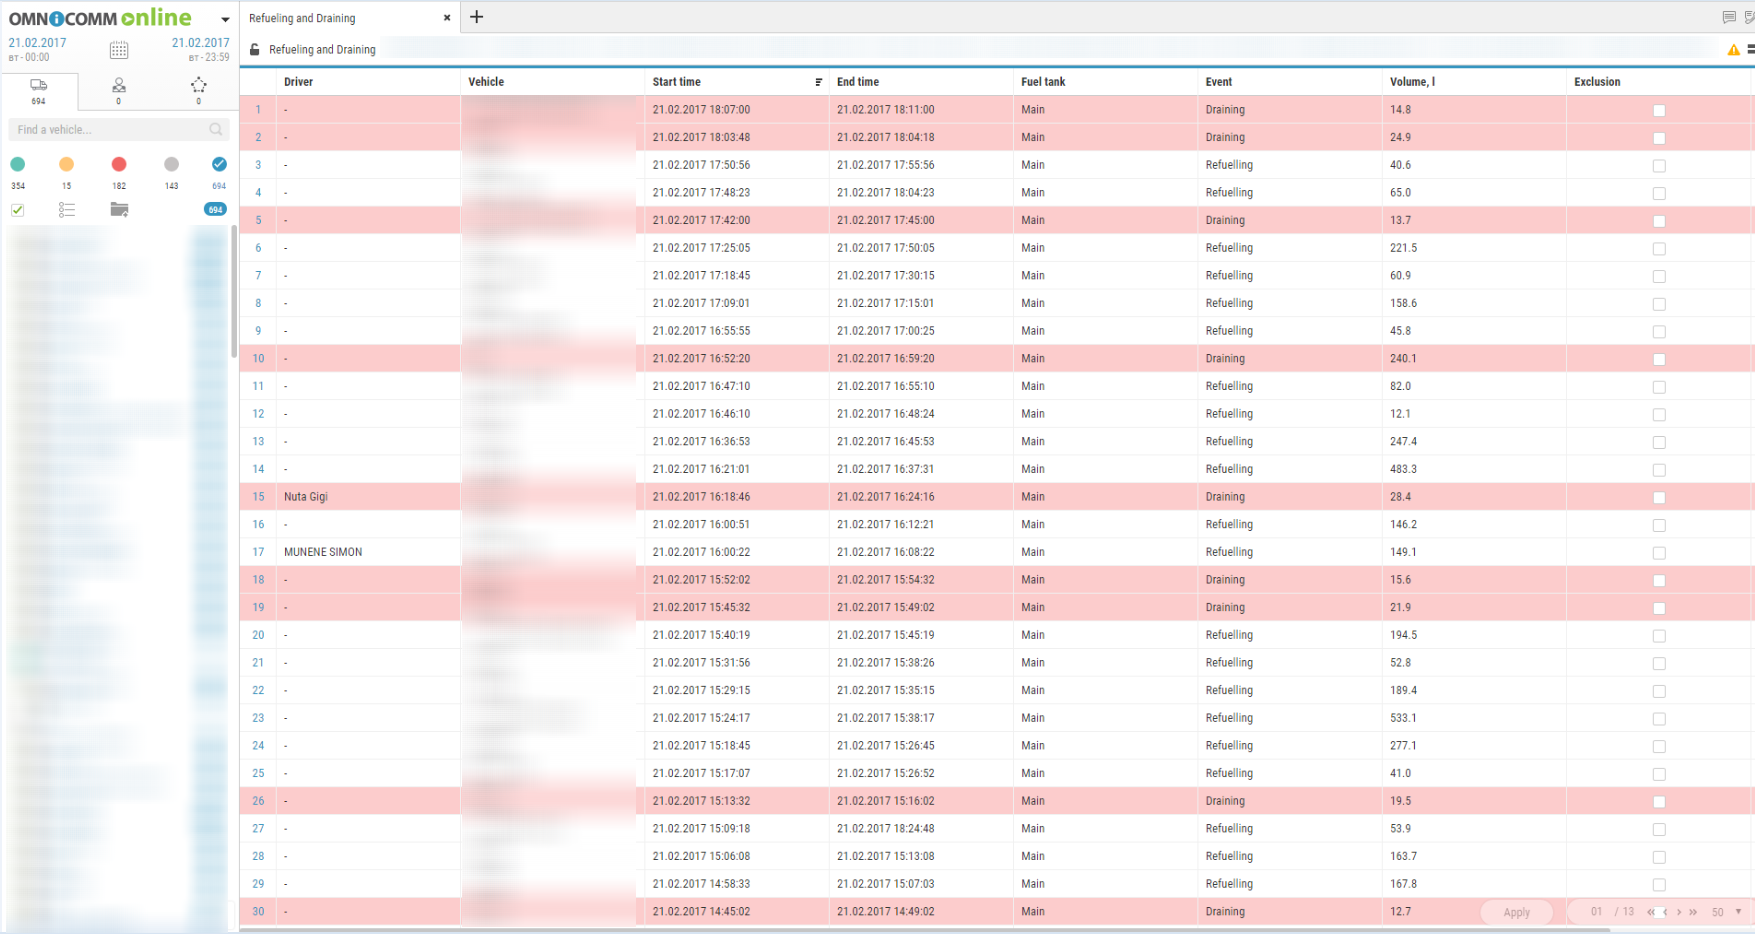
In the program window the list of refuellings and drains within the selected period will be displayed.
The report contains following data:
Volume, start and end time of refuelling/drain according to Omnicomm Online data
Fuel capacity (basic or additional)
Event (drain or refuelling)
Exception tick if it is required to except drain or refuelling from the report. This feature is available only to user to whom appropriate rights are assigned. Press button “Apply”.
Date/time of fuel card transaction: date and time of refuelling according to the fuel card data
Volume of fuel card data refuelling — volume of refuelling according to fuel card data Difference, l — difference in volume of fuel filled in between Omnicomm Online and fuel card data.
It is calculated by the formula: Difference, l=Volume according to fuel card data is a volume according to Omnicomm Online
Difference, % is difference in volume of fuel filled in between Omnicomm Online and fuel card data. It is calculated by the formula:
Difference, %=Volume according to fuel card data is a volume according to Omnicomm Online/(Fuel card data volume)*100%
The address where start of drain or refuelling was performed. To cancel operation exception untick and press “Apply button”.
Upon changing of fuel parameters in VH profile and data recalculation the excepted events won't be returned.
Fuel Volume
1. Select a vehicle.
2. Select a period of time for report generation.
3. Press button “Add report” and select “Fuel volume”.
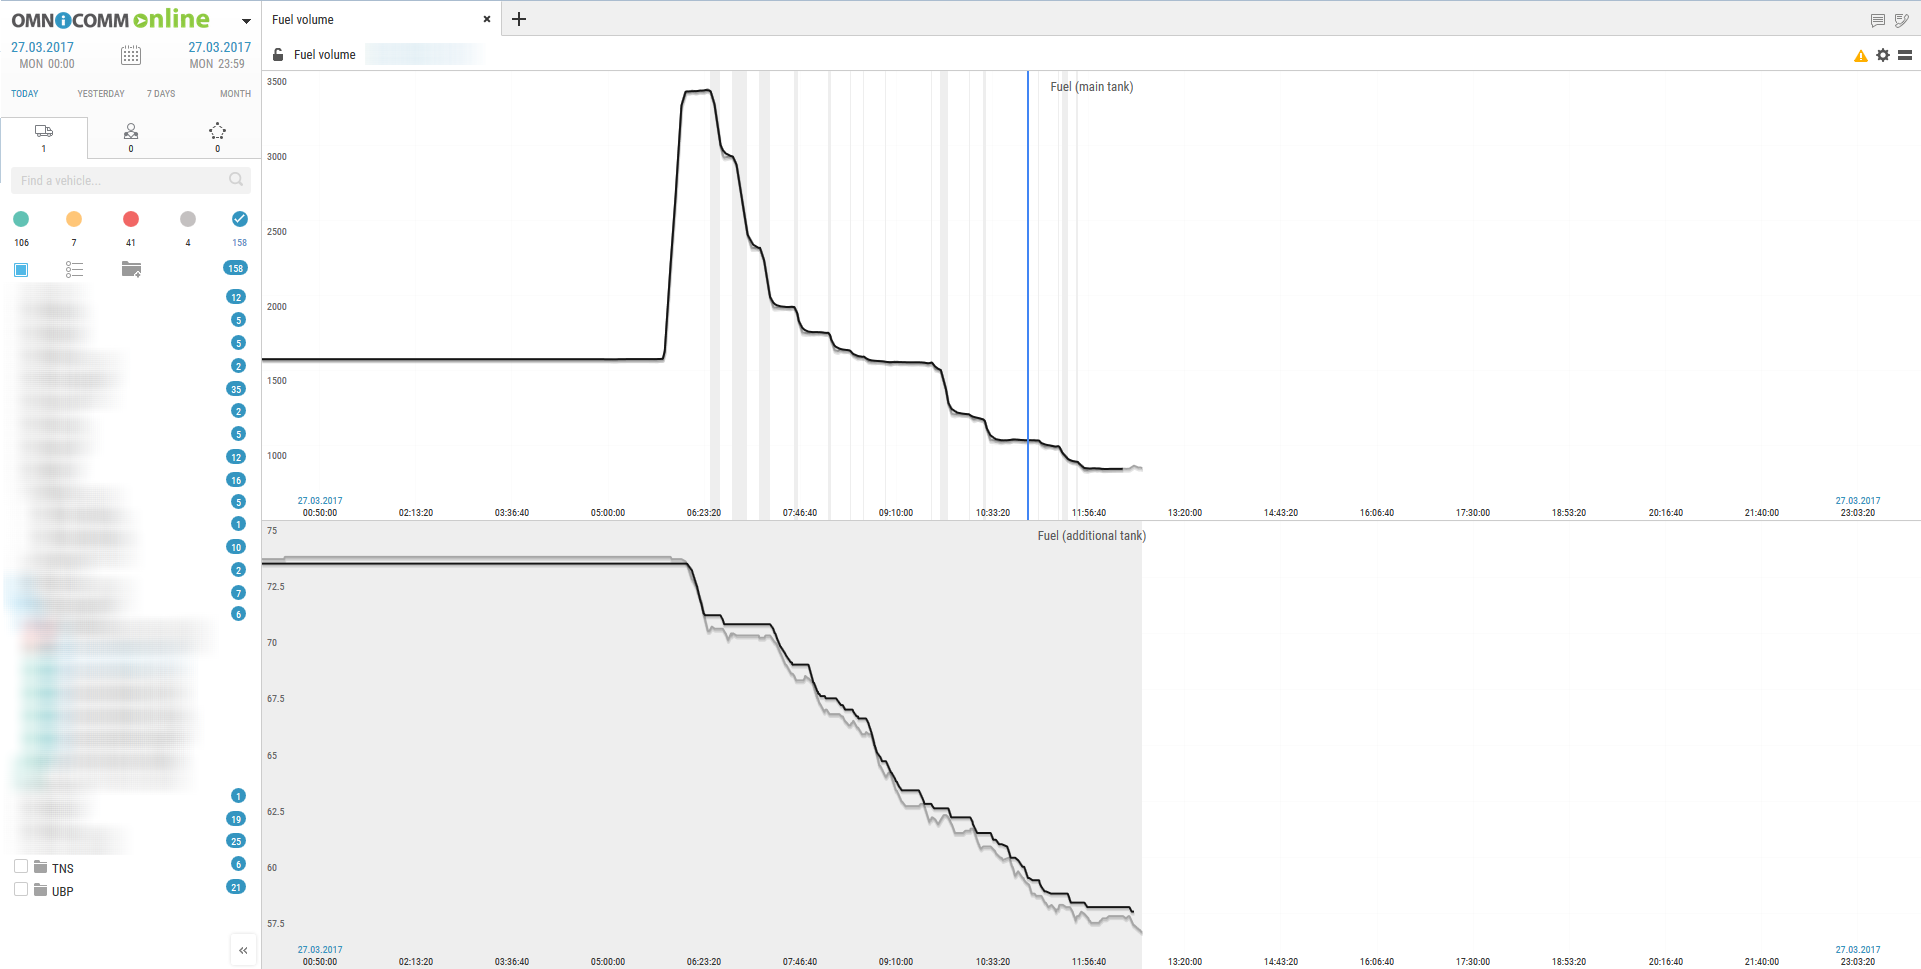
In the program window a report on fuel volume in the tank of VH for the selected period of time will be displayed. In case there are two tanks installed in the VH, report on the fuel volume will be displayed for each tank:
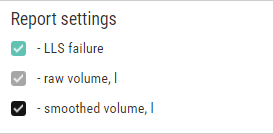
Press the ![]() icon and select the information to be displayed:
icon and select the information to be displayed:
- Green line is time of ignition turn-on
- Red line is time of ignition turn-off
- Gray background of diagram is an engine combustion period
- White background is a period of time during which the engine did not work
- Pink background is a period of time during which a failure of the LLS fuel level sensors took place.
- Gray diagram is a diagram based on “raw” data.
- Black color in diagram is a diagram based on the processed data.
If necessary, increase the diagram scale. Select a part of the diagram, to be increased holding the left mouse button. To return to the original scale of the diagram refresh the report. To display a pop-up tip with an accurate value of the fuel volume select a required spot in the diagram with a mouse pointer.
Fuel Volume (engine hours)
- Select a vehicle.
- Select a period of time for report generation.
- Press button “Add report” and select “Fuel volume” (engine hours).
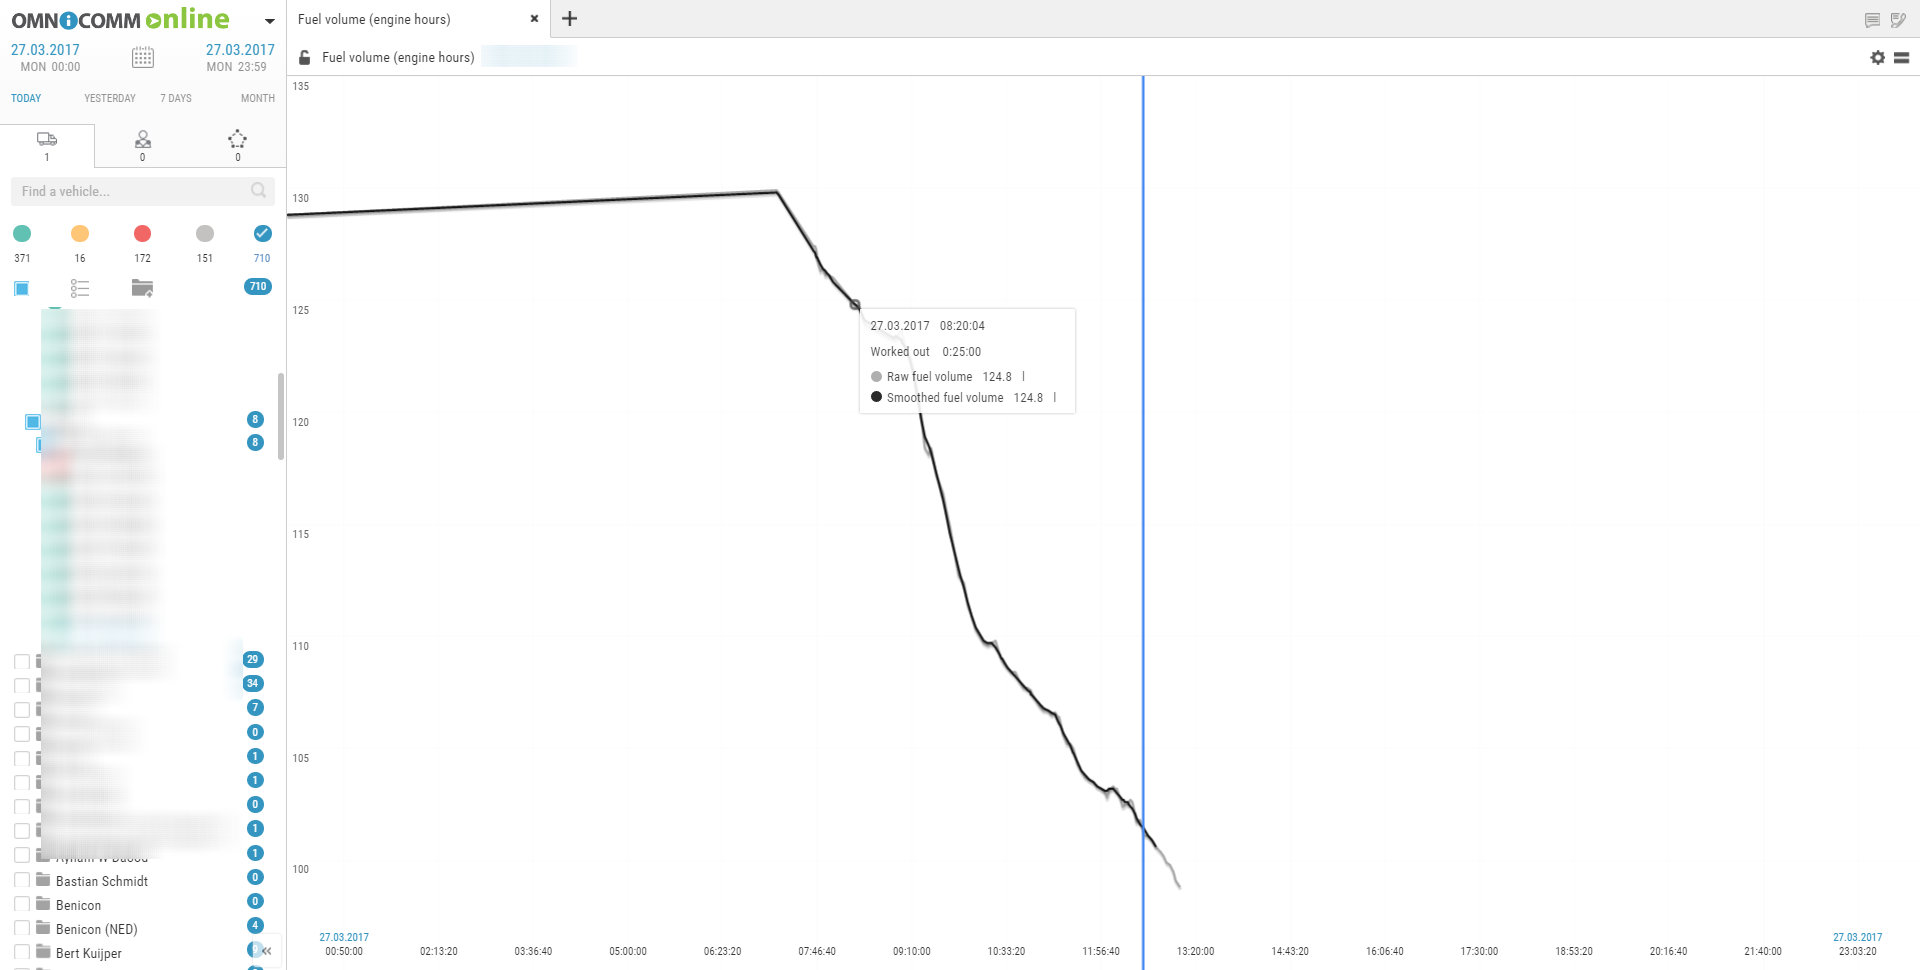
In the program window the report on VH consumption during engine operation will display:
Press the ![]() icon and select the information to be displayed:
icon and select the information to be displayed:
The following color designations are used in the report:
Gray diagram is a diagram based on “raw” data.
Black color in diagram is a diagram based on processed data.
If necessary, increase a diagram scale. Select a part of the diagram to be increased holding the left mouse button.
Fuel Dispensing
- Select a fuel tanker.
- Select a period of time for report generation.
- Press button “Add report” and select “Fuel dispensing”.
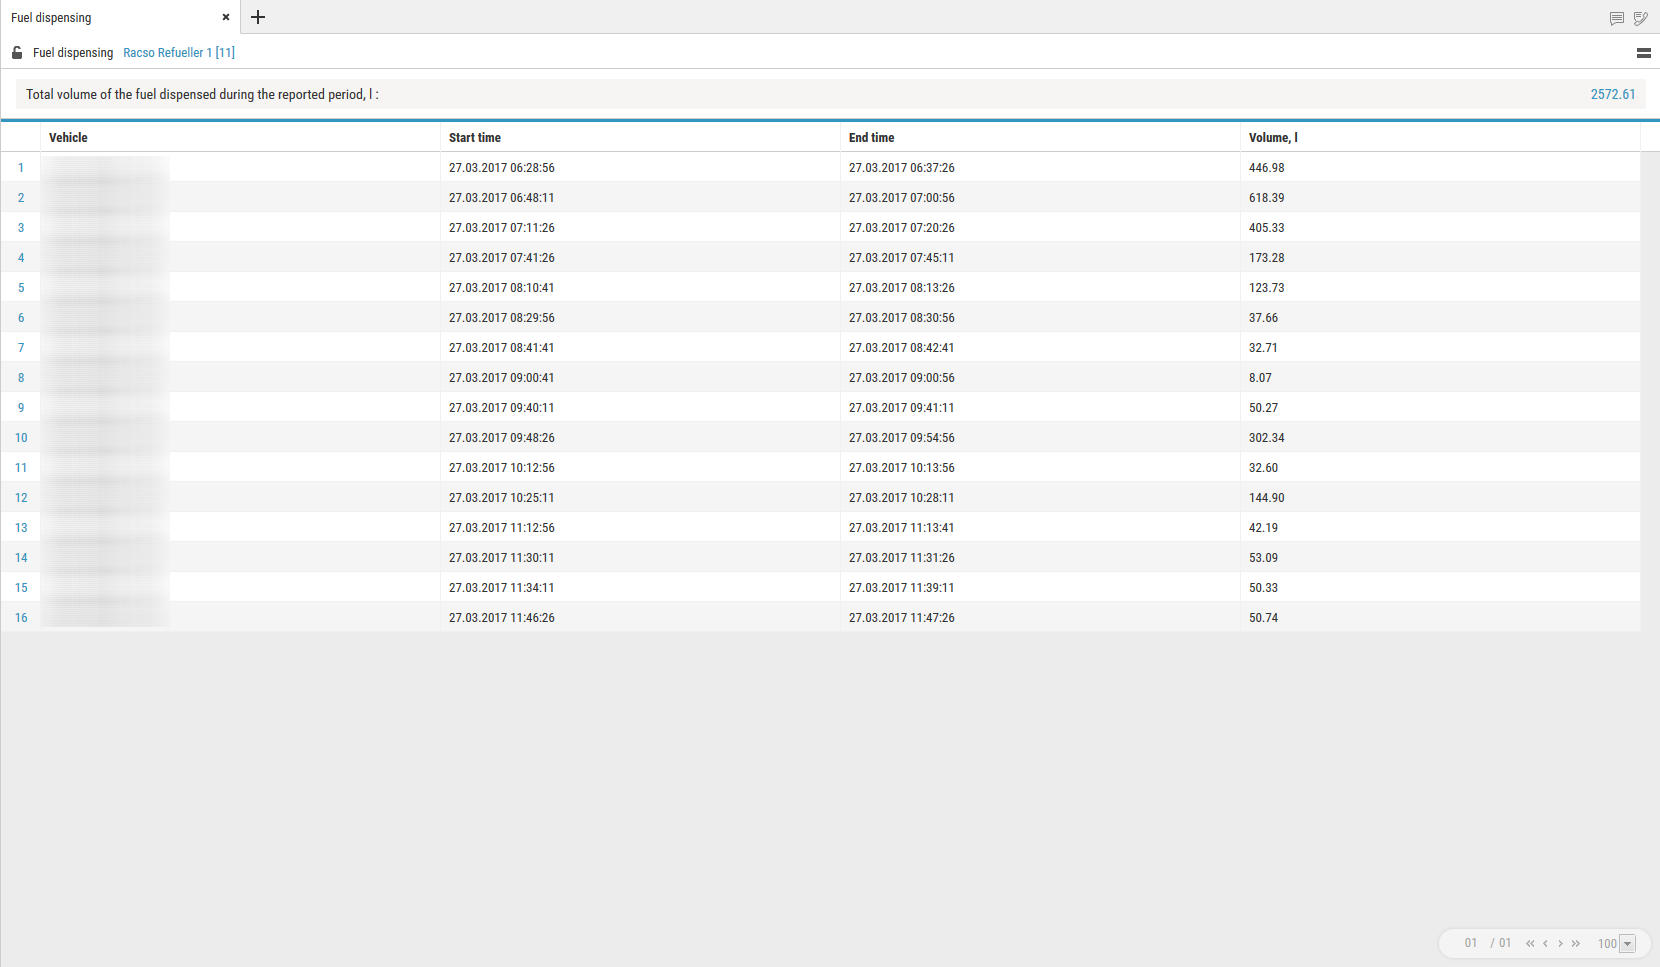
In the program window the report on fuel dispenses by fuel tanker will be displayed:
- The report contains the following information:
- Total volume of fuel dispensed for the selected period, (l)
- Fuel dispensing start/end time, (dd/mm/yyyy hh:mm:ss)
- Volume of dispensed fuel, (l)
Dispenses, filling and fuel volume drained from tank
- Select a fuel tanker.
- Select a period of time for report generation.
- Press button “Add report” and select “Fuel dispensing, fillings and drains”.
In the program window fuel tanker report will be displayed:
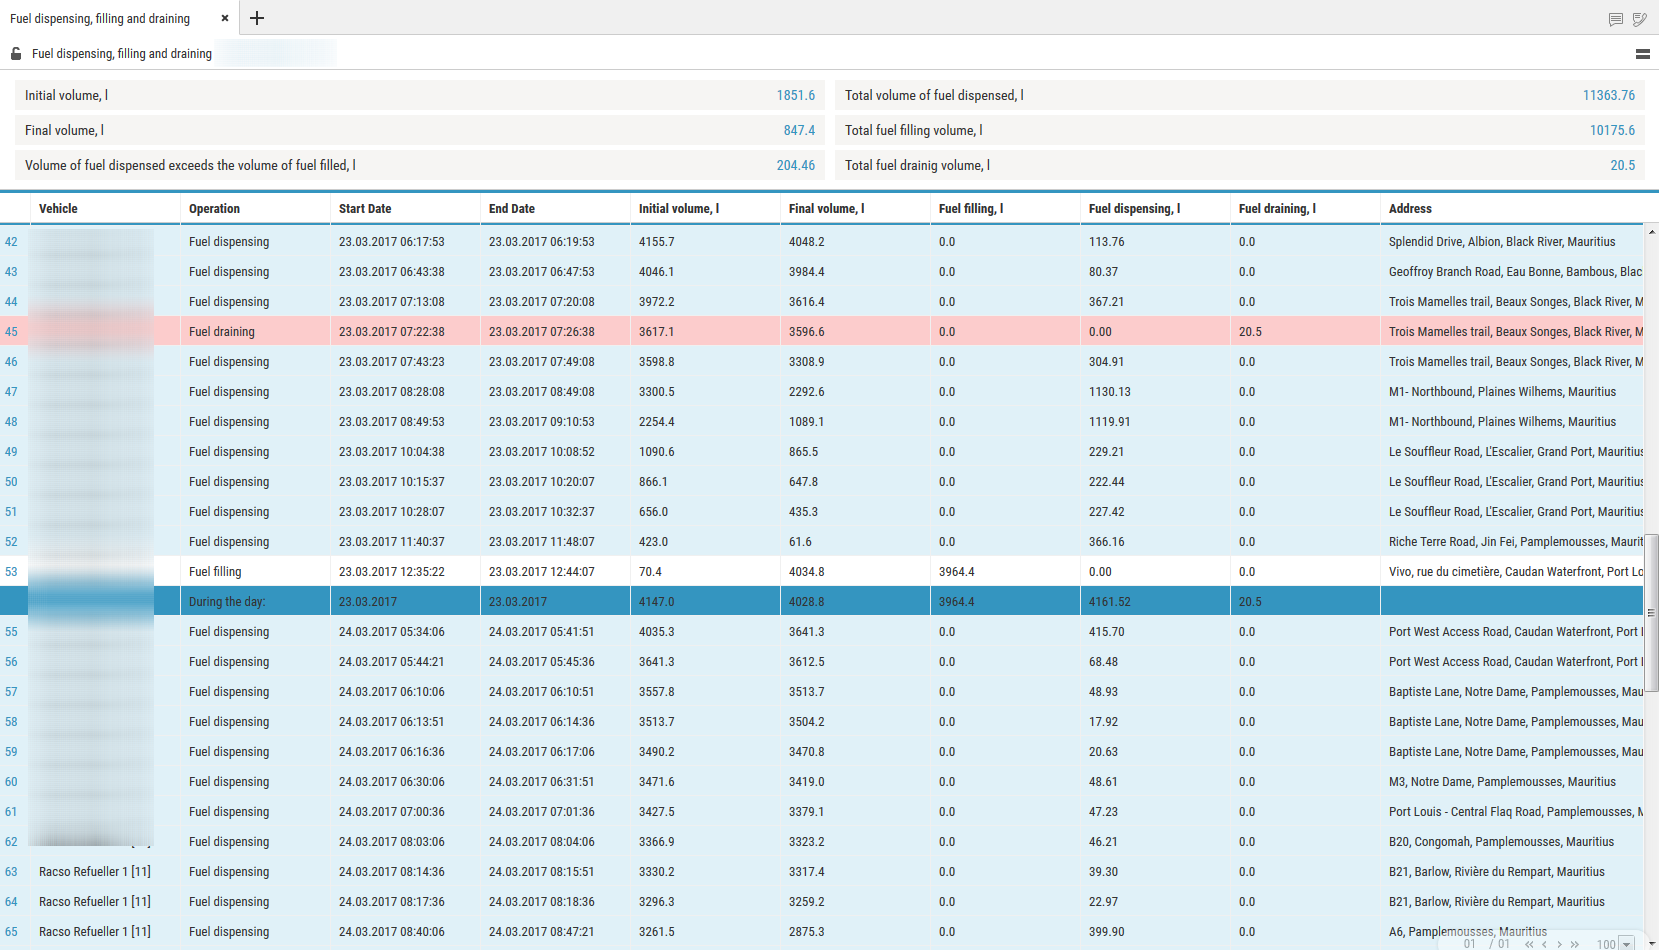
Report is provided with a feature allowing to sort the list by operation, start and end time of operation. The report contains the following general information:
- Initial volume, (l) is the volume of fuel in the tank at the start of the selected period
- Final volume, (l) is the volume of fuel in the tank at the end of selecte period
- Increase of dispense volume over fillings volume, (l) or potential drain, (l) is the difference between readings of LLS Fuel level sensor and counter is calculated by the formula:
“Difference between readings” = “Initial volume” - “Final volume” + “Volume of fillings” – “Volume of drains” - “Volume of dispenses”.
If the value “Difference between readings” is less than zero, the parameter “Excess of dispenses value over fillings value, l”
If value “Difference between readings” is less than one of maximum values: “Fuel draining threshold”, “Refuelling threshold”, “1% of fuel tank volume” or “20 liters”, Omnicomm Online assumes “Increase of dispense volume over fillings volume, (l)” to be equal to zero.
If “Difference between readings” is over or equal to zero, Omnicomm Online renames the parameter and displays “Potential drain, l”.
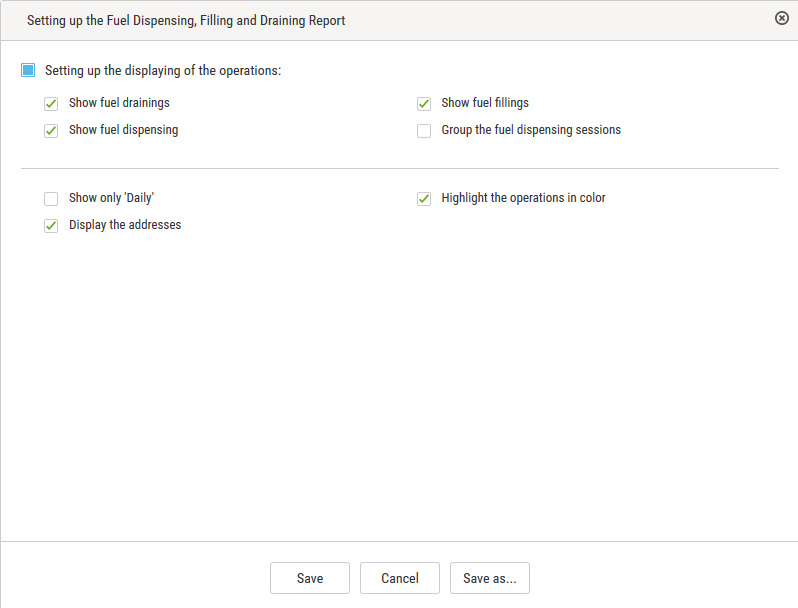
Fillings total volume, (l) is a total fuel volume filled in the tank during the period Fillings total volume, (l) is a total fuel volume filled in the tank during the period Drains total volume, (l) is a total volume of all drains during the period To set up report press right mouse button and select “Report settings”.
There is a feature allowing to apply color indication of fuel drains/fillings/dispense. To turn on color indication select “Select operations with color”. The following color designations are used in the report:
White background of line means fuel filling
Pink background is for fuel drain
Blue background of line means dispense, drain+dispense; filing+dispense;
drain/refuelling start; end of drain/filling
If it is required to display the information only for one day select “Display ‘For one day only’”.
Dispenses display can be grouped. One group of dispenses includes all dispenses which took place during a time period specified in the VH profile. The group may include only one dispense, if no dispenses took place after this one.
Acoording to the LLS sensors readings for a group of dispenses an initial (the volume of the first dispense in a group) and end value of fuel volume in the tank (the volume of the last dispense in a group) are recorded.
Comparison of cumulative volume of all dispenses in a group with change of volume in the tank is performed. If values are different by a value which greater than the allowed value, an additional drain or refuelling performed during dispenses are recorded:
Decrease of volume in the tank is greater than cummulate value of all dispenses, additional drain of fuel is recorded (e.g. performed through lid and access holes in the tank).
Decrease of volume in the tank is less than total volume of all dispeneses, an additional refuelling of fuel to the tank (e.g. if fuelling operator “twists” dispense counter in order it woul correspond to paper fuel ticket with fuelling nozzle being put to the hatch of their own tank).
If necessary the analysis of the motion of fuel and development of embezzlements and manipulations, group of deliveries it should be grouped so that they would be mapped into the report by one line. If it is necessary to examine all dispenses performed from fuel tanker, groups of dispenses can be ungrouped and only one dispense will be displayed in the line, and the size of table will increase.
To switch grouping select “Group dispenses”.
Apply settings by pressing “Save”.
This report table the following information:
“Operation“ inludes operations performed with fuel in the tank.
“Fuelling” is fuelling to the tank.
“Drain” is drain from the tank.
“Dispense” is fuel dispense through fuel nozzle.
“Dispense + Drain” is simultaneous dispense of fuel through fuel nozzle and fuel drain from the tank.
“Refuelling + drain” is simultaneous drain of fuel to the tank and dispense of fuel through fuel nozzle.
“Start” is a date and time of an operation.
“End” is a date and time of the operation end.
“Initial volume” is a volume of fuel in the tank at the moment of the operation start.
“Dispense, (l)” is a volume of dispensed fuel upon fullfilment of the “Dispense” operation.
or “Refuelling + dispense”
“Drain”, (l) is a volume of drained fuel when performing “Drain” or “Dispense + Drain” operation
“Refuelling, (l)” is a volume of fuel filled to the tank.
Address is an address of dispense. It is displayed only for group fuel dispenses.

